Articles

Changeover Time
Changeover time represents the elapsed time to changeover from the production/processing of one product or service to a different product or service. Admittedly, there is little math involved here. Some readers may scratch their heads and wonder why one would need a math entry at all! However, changeover time is important in the overall scheme of Lean Math and, with it, the principle of flow and pull. More specifically, internal changeover time (T∆i) is a critical driver of batch sizes, lead time, and intervals.
Benchmarking and the Absolute Benchmarking Process Efficiency Ratio
Neil always used to confound and shock me. He was always pursuing perfection. And I would always retort something like, “But, the real world isn’t perfect.”
Over the years, I slowly realized the value and wisdom of Neil’s mindset. It is consistent with traditional lean thinking (as long as it does not paralyze the PDCA cycle), and it helps drive innovation and the right thought process. I have found that lean thinkers not only benchmark themselves against the competition, they also benchmark themselves against perfection. This is where math can help.
New Book, New Look, and New Content
 New Book. A handful of weeks ago, SME published our new book, Lean Math: Figuring to Improve. It is, and was, undoubtedly a labor of love…or at least the 444-page labor of Dr. Mike (aka Michael O’Connor) and me.
Inventory Record Accuracy
How you measure Inventory Accuracy depends on where you stand.
Product Family Analysis
Value stream analysis is conducted typically for one specific product or service family at a time. In order to identify and distinguish families, lean practitioners use what is called a product family analysis matrix (a.k.a. product quantity process matrix (PQPr)). Many times the families can be easily discerned once the matrix is populated, other times, it is more difficult. The application of a dendogram or binary sort, can be helpful in these situations. Value stream analysis and, with it, flow kaizen, is central to any lean transformation and is specific to product or service families.
Taichii Ohno
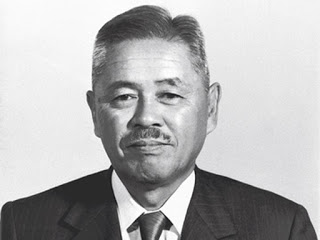 Born February 29, 1912, Taichii Ohno envisioned a way of working that would evolve into the Toyota Production System (TPS), now known widely as Lean.
Combinations and Permutations. Count the Ways.
Combinations and Permutations How many different poker hands are there? How many different pizza orders can be made? How many different ways can this work schedule be filled out? How many different ways are there to arrange your books in a bookshelf? These are all examples of combinations and permutations. And knowing how to calculate them is a helpful tool for decision making. The basic equations are: .
Pitch Interval for Same Pitch Products
Pitch interval (Ip) can be thought of in two ways: 1) as a unit of time representing the (usually) smallest common pitch shared among a range of products, services, or transactions that are being produced, conveyed, performed, or executed by a given resource(s), and 2) as a count of the number of intervals of a common pitch over a period of time, typically a shift or day.
How bad could it be? - Risk Priority Numbers
Life happens. Sometimes it rains on wedding days. Sometimes a supplier misses a ship date, and sometimes there are glitches in our processes. The challenge for lean practitioners is what to do about this – especially since all of these things could happen.