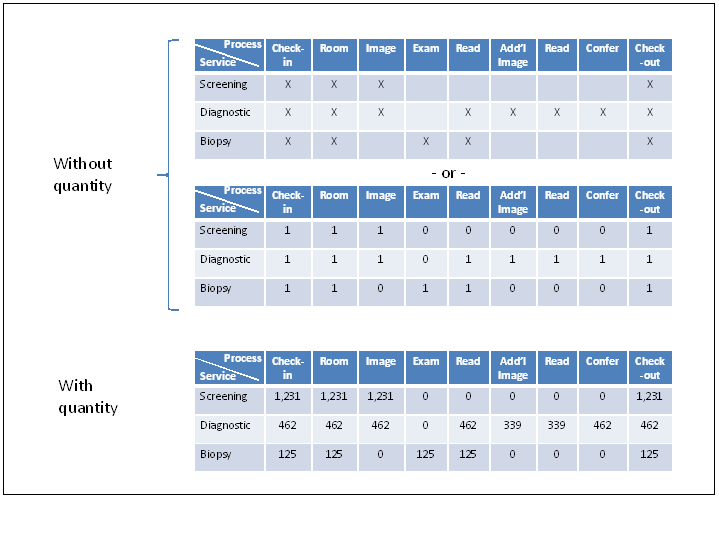
Value stream analysis is conducted typically for one specific product or service family at a time. In order to identify and distinguish families, lean practitioners use what is called a product family analysis matrix (a.k.a. product quantity process matrix (PQPr)). Many times the families can be easily discerned once the matrix is populated, other times, it is more difficult. The application of a dendogram or binary sort, can be helpful in these situations. Value stream analysis and, with it, flow kaizen, is central to any lean transformation and is specific to product or service families. This means typically one map set, both current and future state, per family. Clearly, it is important that the lean practitioner properly identify and discriminate between families before beginning any value stream mapping effort. Families are represented by products or services that share, more or less, the same common processing steps. The product family analysis matrix, also known as a product family matrix, process routing matrix or product-quantity-process (PQPr) matrix is a common tool for product family identification. At their most basic levels, the matrices reflect the product or process offerings on the y-axis and the process steps on the upper x-axis (Figure 1). The intersection between the x’s and y’s is indicated by an “x” or checkmark, a zero or one, or the frequency/quantity (i.e., the products annual volume through a given process). The intersections, or “clusters,” represent product family candidates.  There are three methods of identifying product clusters – sorting by inspection; cluster identification using dendrograms; and binary sorting. We'll cover these topics in future postings.
Product Family Analysis
Blog contents Copyright ©2009-2024 Mark R. Hamel. The views expressed herein are solely personal views and not those of associates, clients or employers. Comment functionality has been deactivated. Please contact [email protected] with any questions or comments.
