Vilfredo Pareto
 Vilfredo Federico Damaso Pareto was born 165 years ago on July 15, 1848. As an economist Pareto established that 80% of the land in Italy was owned by 20% of the population.
"Lean Math." Now, there's a name that evokes passion in the heart of every lean practitioner!?
But, the truth is effective lean transformations require some level of math, whether it's the often deceptively simple calculation of takt time, sizing kanbans, calculating process capability, or anything in between. It's hard to get away from math-free lean and certainly math-free six sigma!
Lean Math is not intended to be some purely academic study and it does not pretend to be part of the heart and soul of lean principles. Rather, it's a tool and a construct for thinking. Here we want to integrate lean math theories and examples with experimentation and application.
In the end, we hope the blog, along with its fledgling community, lives up to the tag line, "Figuring to improve."
Vilfredo Federico Damaso Pareto was born 165 years ago on July 15, 1848. As an economist Pareto established that 80% of the land in Italy was owned by 20% of the population.
Pitch is a representation of takt image - a visual and often audible management timeframe that lean practitioners use to pace and monitor value stream performance. It is typically driven by, and linked to, a value stream or line’s pacemaker process. Pitch performance is routinely tracked and reinforced with plan vs actual charts (a.k.a. production analysis boards), digital displays, lines that are “pulsed” or indexed every time interval, etc.
An interesting pattern often emerges when you graph the coefficient of variation (Cv) vs. volume of a process time series.
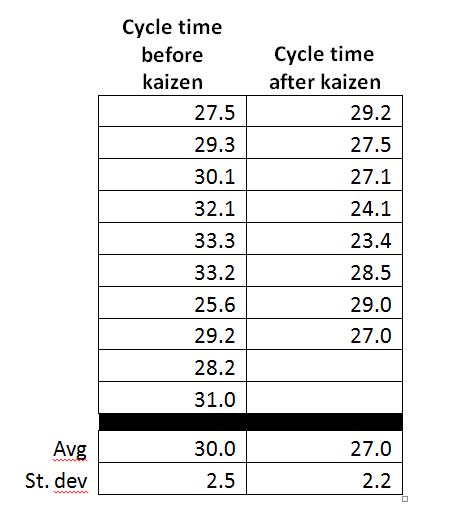
So you cut your cycle time by 10%.
...Or did you?
Recently a reader posed the following value stream mapping lead time related question(s). My experience, after facilitating more value stream mapping activities than I care to remember, is that it's not an uncommon question. In fact, it's a very good question.
I provided a quick answer...supplemented by a very sophisticated graphic (recently enhanced, in red, based on a comment from Sandor).
Σ or Sigma is the Greek upper case capital letter S and is used in mathematics to represent summation or addition of a series of elements or set of data values.
x1, x2, x3, ... xn is a set of numbers. x1 is the first number in the set, xi is the 'i'th number, xn is the last of n numbers.
Elements can be simply adding up a set, or more involved such as summing squares or other algebraic equations.
Haruhiko 'Harry' Matsumura wrote a comment "Hi, Sirs, Regarding square root law of inventory, I prepared a useful kaizen proposal paper to give my clients to address stock reduction by means of location."
Machine cycle time (Tcm) represents the actual time it takes for one machine to complete all of its operations on one piece, product, patient, file, etc.
Every Part Every Interval, also known as EPEI or EPEx, represents the frequency that different parts are produced or services provided within a fixed repeating schedule. This fixed repeating schedule is often graphically portrayed, for training purposes and as a scheduling visual control, as a wheel, with the different products represented by alphas (A, B, C…) and the wheel indexed clockwise to follow the intended sequence.
![]()