Recently a reader posed the following value stream mapping lead time related question(s). My experience, after facilitating more value stream mapping activities than I care to remember, is that it's not an uncommon question. In fact, it's a very good question.
I provided a quick answer...supplemented by a very sophisticated graphic (recently enhanced, in red, based on a comment from Sandor).
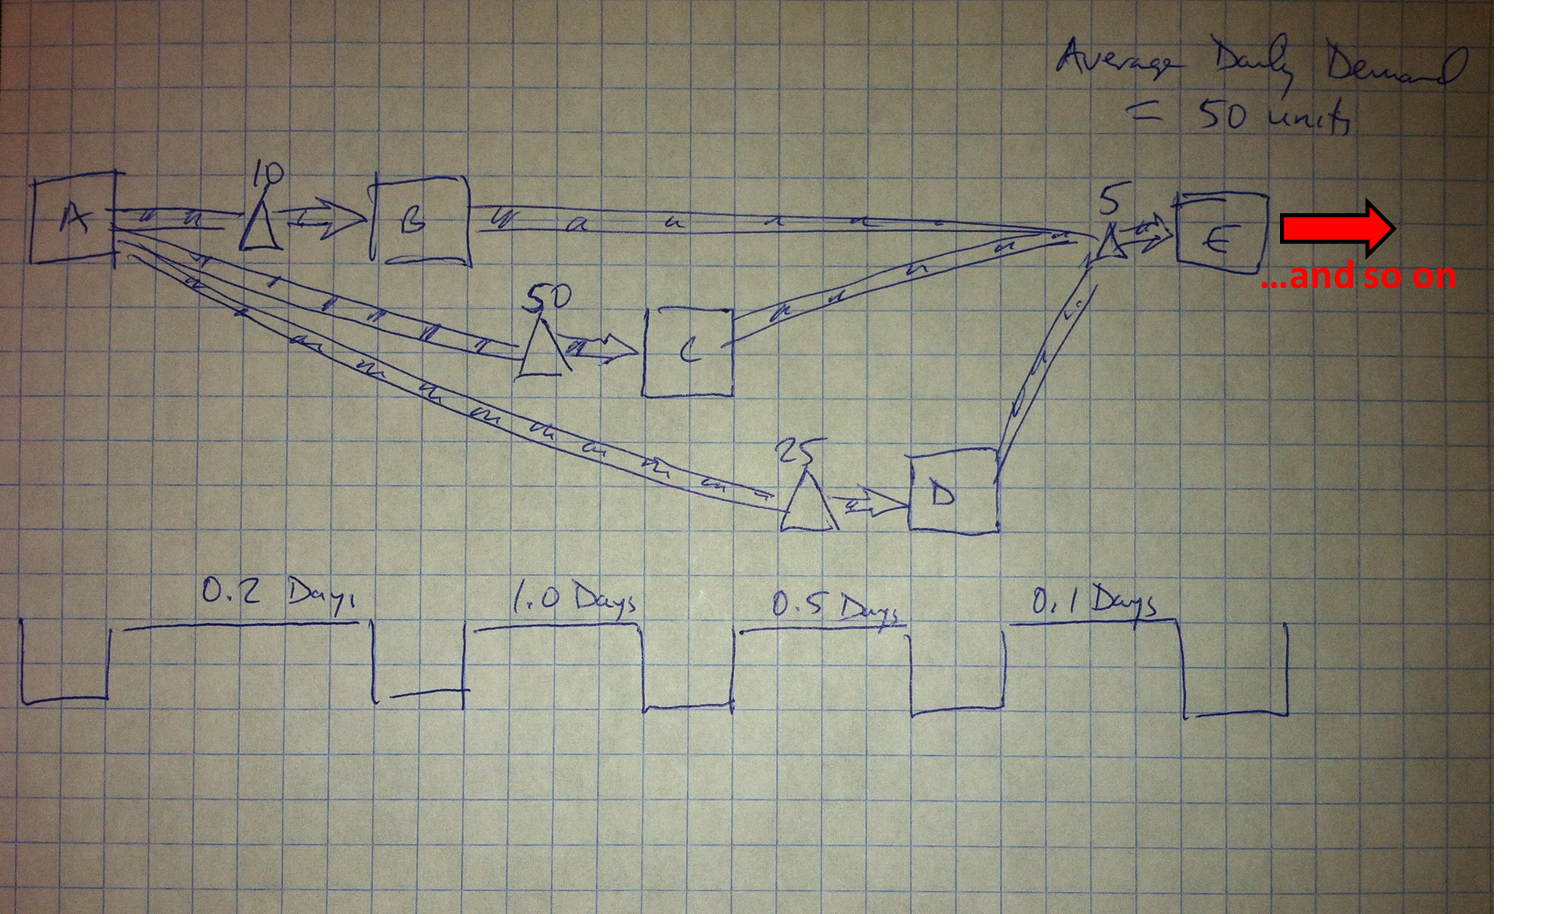
Q: Say you have a value stream map that after Process A is complete, can either go to B, C, OR D and then no matter the process, continue to E from there. How do you go about adding up lead time? Do you just take the longest of those three times or an average?
A: In such a situation, lead time, as reflected on the “top rung” of the lead time ladder, is based upon the inventory in the system. The lead time on each rung is typically calculated by dividing the average daily demand by the inventory count associated with the triangle (typically) above that rung. This will provide lead time in terms of days or fractions of a day. (There are other methods, but this one is probably the most simple.)
So, the question is whether there is inventory before B, C, and/or D and how much. Then, calculate the lead time related to each inventory triangle. See the attached picture for a quick example.
 Related post: Value Stream Mapping Math: Lead Time Ladder Process “Branch”