When evaluating countermeasures, it is common to determine which countermeasure has the best average result. A lazy analyst may then conclude that the countermeasure with the overall best average is the preferred solution. On many occasions this intellectual sloth may result in the best choice, but there are some occasions where this type of thinking could result in disaster.
The wrongheaded thinking arises from not realizing that just because the average result is better; it doesn’t mean that the overall results are better.
Consider the following situation. You are trying to reduce the response time to customer requests. The specification for the process is that all customers will be served within 110 seconds. The current process (C1) has an overall average response time of 100 seconds and a standard deviation of 5 seconds. The revised process (C2) has an overall response time of 90 seconds but the standard deviation has increased to 20 seconds.
Which process is better?
As we can see in the figures below, process C1 is better at meeting the specification in spite of the higher overage. The variation in process C2 is significantly higher than C1 and this increased variation negates the benefit of the reduced average.
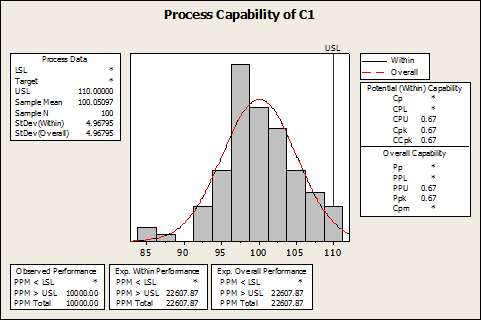
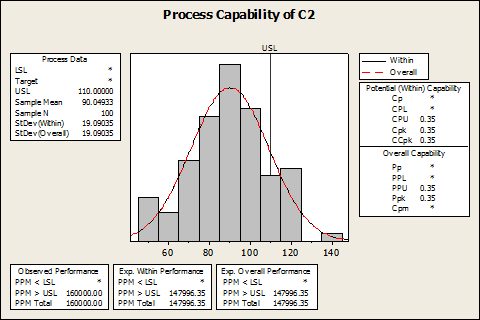
The moral of the story is when specifications are involved it is often not good enough to compare the average to the specification, run a process capability analysis as well.