Accurately determining the appropriate stocking levels of perishable items is very important. Stock too few items and you will have disappointed customers. Stock too many and you’ll have unsold product - which has a high probability of turning into a loss.
A number of industries face this dilemma each and every day.
For example, how many seats should an airline sell for a flight? If a carrier sell exactly the same number of seats that are on the plane, then they are almost certain to have empty seats. If they oversell too much, they are likely to strand passengers and create some serious angst...especially around this time of year when people are trying to get home for Thanksgiving and their favorite apple pie.
There are a number of ways to model and address these questions, perhaps the easiest way is to simply do a numeric simulation.
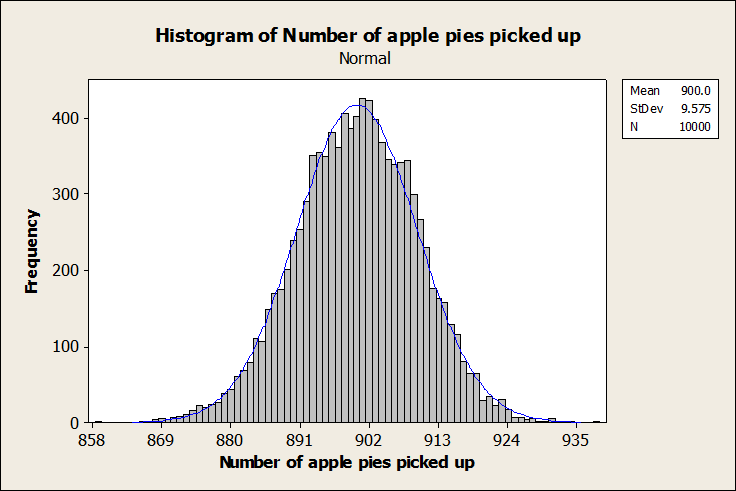
Let’s say that a bakery has 1,000 customers and they expect 90% of their customers to purchase an apple pie. In this case, the number of customers that actually pick up an apple pie might look like this:
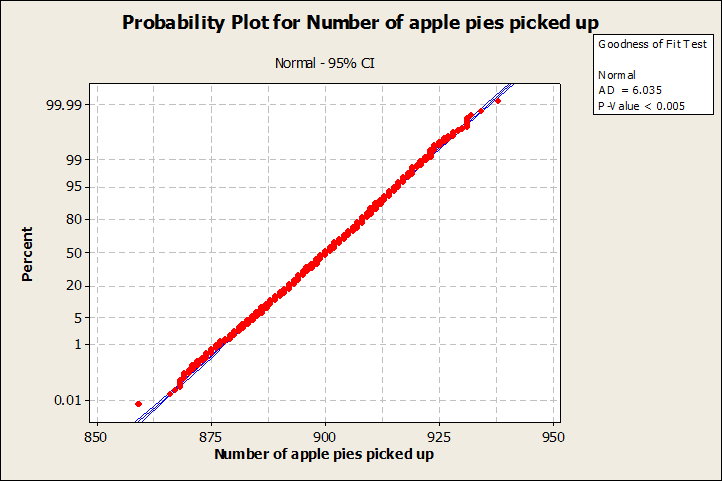
 Ten thousand cases were simulated for the above graph and not surprisingly, the average number of apple pies picked up is 900 (i.e. the number of customers multiplied by the likelihood that each customer will pick up an apple pie). But, the real interesting questions tie to how much variation there is in this distribution, because that determines how many pies the bakery needs to make. That is, if we just rearrange the data and plot it as a cumulative probability (see figure below), we can see that 99.99% of the time, customers picked up fewer than 937 apple pies.
 And, if you do these numeric simulations enough, for different number of customers (n) and differently probabilities (p), you will notice that the average number of apple pies picked up (x-bar) is:
![]() And the standard deviation of the distribution (σ) is:
And the standard deviation of the distribution (σ) is:
![]() which is simply a binomial process in action.
which is simply a binomial process in action.
Happy Thanksgiving, everyone. Enjoy your apple pie!
