Lean practitioners must properly identify product families in order to value stream map a given family’s flow of material and information. That’s very important, but not always simple.
In order to illustrate how to identify product families and thus value streams, consider the following example. Three different patient groups go to a hospital. The treatment for patient groups 1 and 2 consists of three steps A, B, and C. However, the treatment for patient group 3 consists of only step D.
Because the treatment for patient groups 1 and 2 share the same process steps they most likely represent the very same value stream. But, the treatment for patient group 3 goes is sufficiently different that it might be thought of as a unique value stream.
The treatment for the patients is summarized by the following product family matrix.
|
|
Process A |
Process B |
Process C |
Process D |
|
Patient group 1 |
1 |
1 |
1 |
0 |
|
Patient group 2 |
1 |
1 |
1 |
0 |
|
Patient group 3 |
0 |
0 |
0 |
1 |
For matrices as basic as this one, it’s very easy to identify families simply by what we can call a sort by inspection method. However, for more complex product family matrices this method becomes impractical.
A little math can provide some needed help when confronted with really large and complicated matrices. You know, the ones where product families are less than obvious - lots of rows, lots of columns, and a lot of variety.
To continue with our hospital example, the math is a simple calculation of how different the treatments for each patient group are. Since the treatment for patient groups 1 and 2 consists of going through the same three process steps, the difference between their treatments is zero.
But, clearly the treatment for patient group 3 is different.
How different?
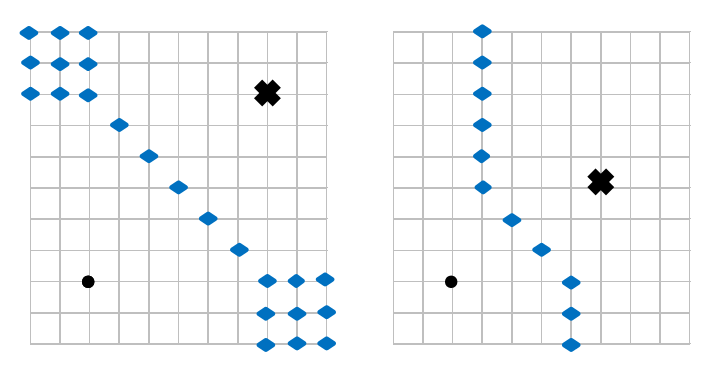
Well, there are four process steps that are different, so the difference is four. This difference is called the Manhattan distance because it mimics the calculation of how many blocks one intersection is from another. The following two figures illustrate the concept of Manhattan distance. The diamonds in the figures mark all the points that are equidistant between the dot and the cross. That is, if where you lived was marked by the dot, and a friend of yours lived at the cross, the diamonds represent all those places where you could meet your friend where you both walked the same number of blocks.
 The equation to calculate a Manhattan distance is:
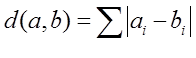 Where a and b are any two rows in the product family matrix. Using Manhattan distances is helpful when sorting product family matrices because the Manhattan distance between any two rows of a product family matrix is equal to the number of process steps that are different between those rows.
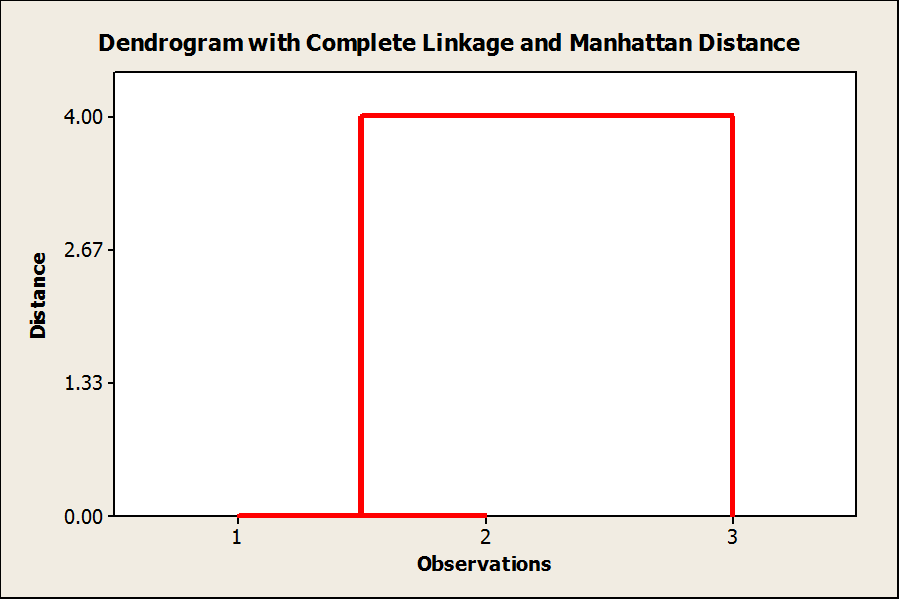
Now that we identified a simple way to calculate the number of process steps that are different between product family rows, we now want to group the rows of the product family matrix into cluster according to their similarity. Fortunately, a dendrogram makes quick work of that task.
Dendrograms group all identical rows of the product family matrix into their own clusters and then joins those clusters based on the distances between the clusters. The figure below is the dendrogram for product family matrix for the three patient groups. Notice that patient groups 1 and 2 are joined into a cluster and patient group 3 has its own cluster. These two clusters are joined together at a distance of 4, meaning that the distance between the clusters is 4, which is precisely what we calculated before.
For larger, more complex product family matrices the dendrograms typically have a lot more structure and a lot more clusters. The complete linkage method tells the algorithm that joins the clusters to join the clusters at the highest distance between the elements of the clusters. That is, for dendrograms with a lot of structure. Smaller clusters are joined into larger clusters, and these larger clusters are joined into even larger clusters and this process is repeated until all the clusters are joined. By choosing to join the clusters using complete linkage, we insure that we don’t overestimate the similarity between the elements of the clusters.
 Once we have identified the clusters in the product family matrices using Manhattan distances and complete linkage, we can then apply commonly used guidelines in order to determine which clusters or which elements of a cluster constitute a product family. Those guidelines include the recommendations that value streams should consist of products that share at least 80% of downstream process steps, that the work content of the products of a value stream should be within 30%, and that products in a value stream should make a sensible grouping.