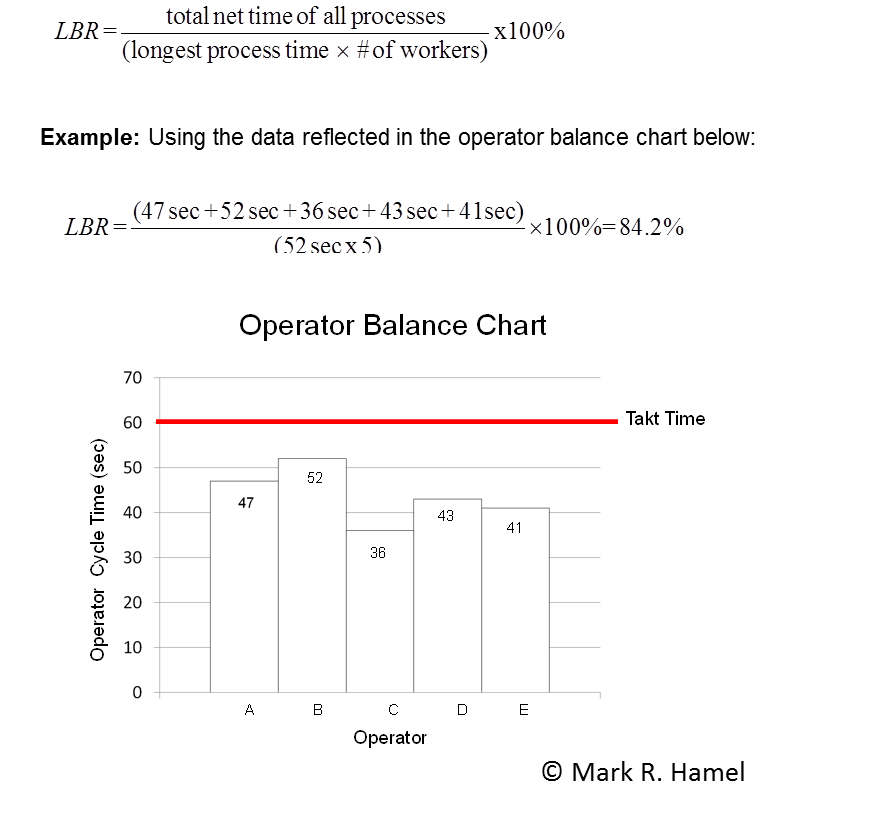
The operator balance chart, also known as a percent load chart, operator loading diagram, cycle time/takt time bar chart, or line balance analysis graph, provides the lean practitioner with insight into how equalized operation time is among the workers within a given process, line or cell. The line balance rate (LBR), and the related line balance loss rate (which is simply 100% minus the LBR), quantifies how well or poorly the line is balanced.
A lack of line balance routinely causes the waste of waiting and/or overproduction. It can also prompt over-processing during which operators, rather than engage in the blatant waste of waiting, conduct “apparent work.” Line imbalance is an enemy of continuous flow.
Some may ask, “What the heck do I do with this?” While there is not necessarily a magical LBR “bogey,” it’s definitely useful when developing standard work and comparing different balance scenarios.
Consider LBR a simple analytical tool. Use it when it makes sense.