In the words of my friend and colleague Larry Loucka, “graphs are math.” Graphs often serve as effective visual process performance tools. Typically, these types of graphs fall into the metric category. As reflected in the supporting concepts of the fourth dimension of the Shingo Prize model, good metrics should: 1. “measure what matters,” 2. “align behaviors with performance,” and 3. “identify cause and effect relationships.” Real lean drives measurable operational and financial performance improvement. Results are typically enjoyed first at the operational level and then, as the transformation matures, the financial benefits follow. 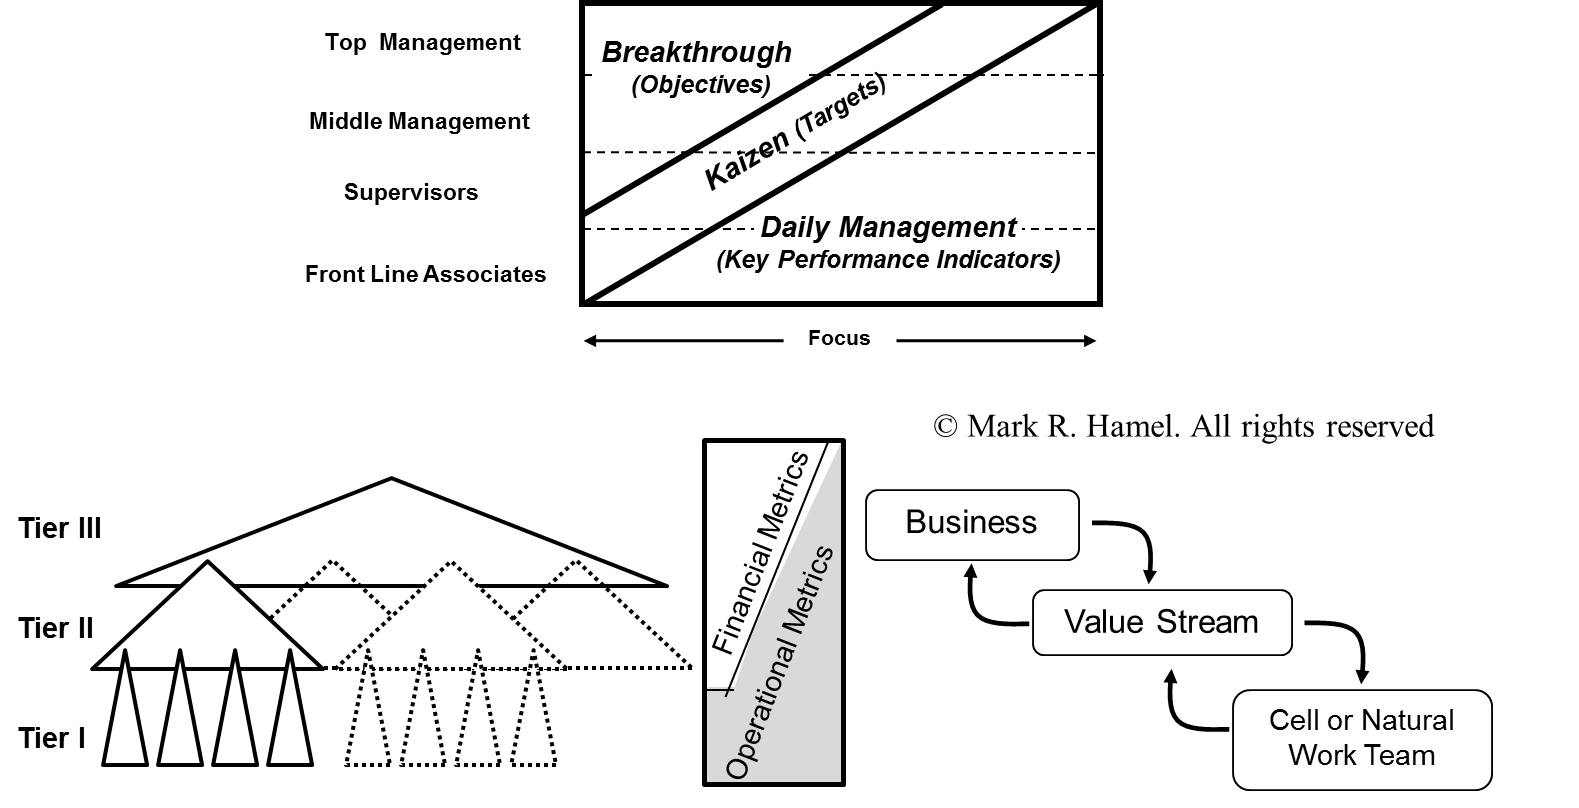 Lean thinkers pragmatically measure critical results and the actionable drivers of those results. Measurement is for the purpose of vertical and horizontal alignment within the organization and the encouragement of desired behaviors within the context of a lean management system. It focuses stakeholders on breakthrough and daily improvement through the characterization of current and target conditions and provides insight into past and present performance. Performance metrics therefore are integral to plan-do-check-act. More simply put, continuous improvement, whatever the scale, is a never ending cycle of measure, improve, and then measure again.
 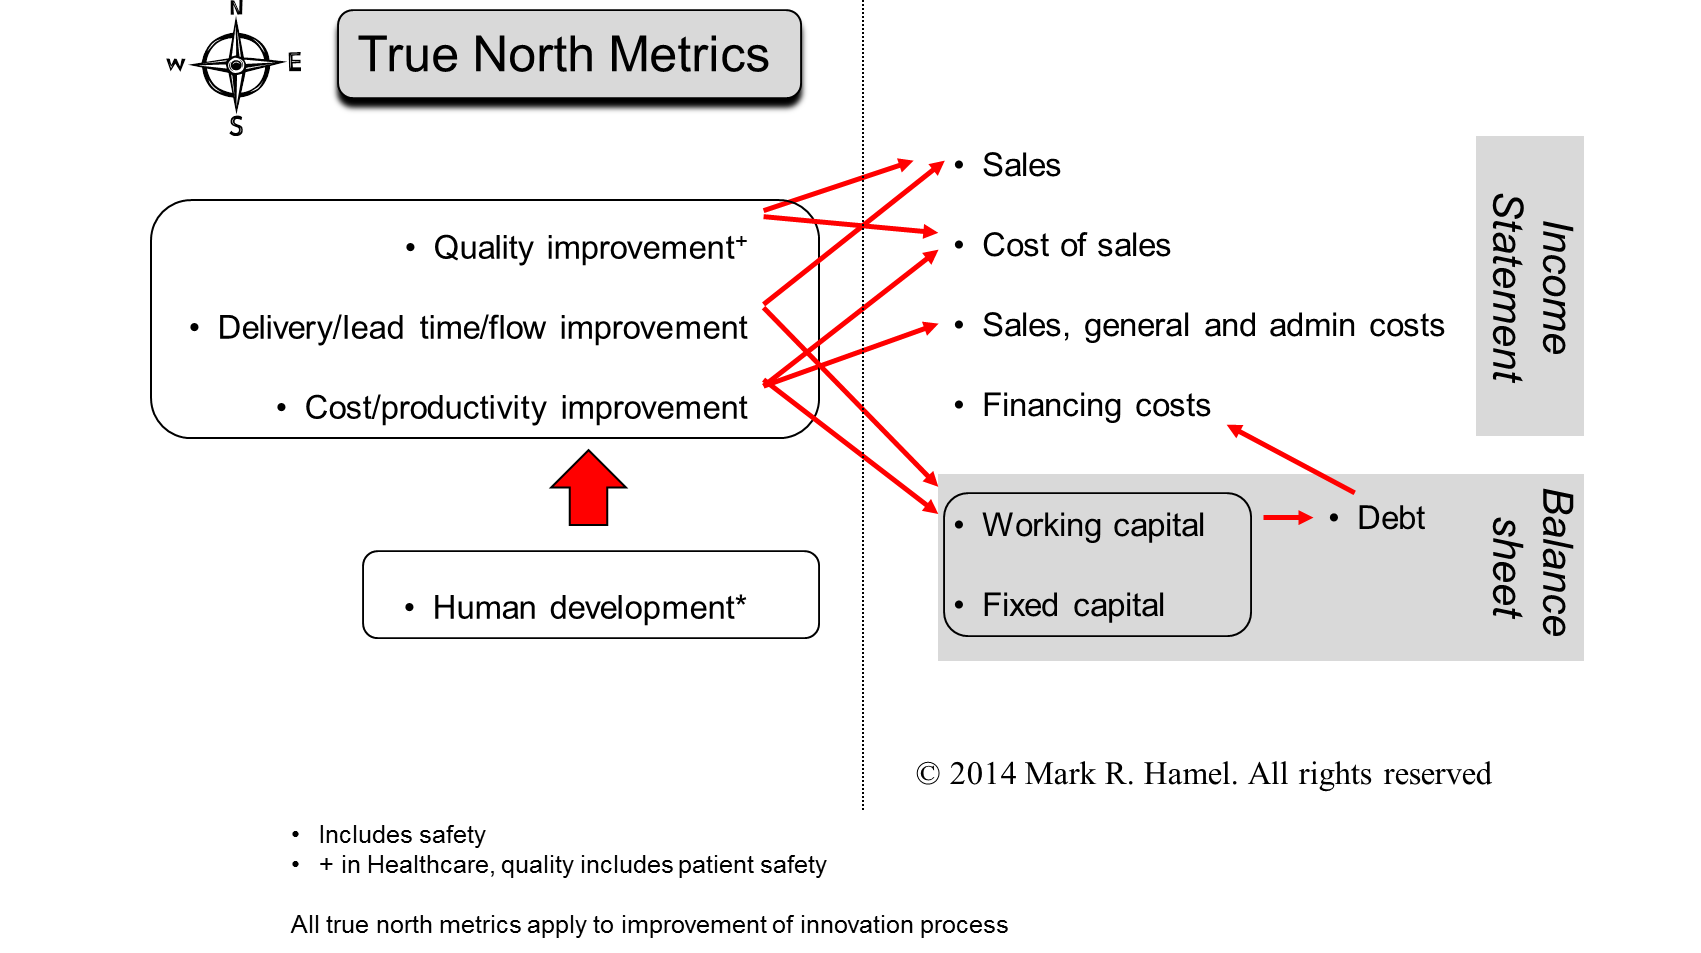 So, what operational stuff should we measure? The fourfold “true north” metrics, reflected in the figure immediately above, represent the critical few metrics that drive business performance and human development. The euphemism “true north” captures the organization’s long-term direction and not simply its daily, weekly, monthly, quarterly and annual performance. Consistent with that thinking, the ultimate targets for true north could be construed as follows:
- quality improvement - zero defects,
- delivery - 100% value adding time,
- productivity - 100% value-adding steps in all work,
- people - 100% of the workforce contributing to improving the work
When contrasting the four true north metrics against the often used “SQDCIM” battery (safety, quality, delivery, cost, innovation and morale), it may initially appear that this true north is incomplete. This is not necessarily the case. “Human development” encompasses both safety and morale and innovation is addressed with the improvement of the four metrics when applied to the new product/service offering development process. However, there is one category that could reasonably be added to these metrics – growth. Lean, especially in concert with relevant strategic initiatives, drives business growth. A growth metric category explicitly captures performance relative to things like the penetration of existing business accounts and addition of new accounts. The Shingo Prize’s fourth internal measurement area is customer satisfaction (we can slip that under quality). Certainly, that is consistent with growth. In the future, we will share some insights into visual process performance design considerations, related math (surprise!), as well as some examples. And, once in a great while, we may mix in the occasional financial metric. Related posts: Balancing Two Types of Visual Controls within the Context of Lean Management (Gemba Tales), Plan Versus Actual Math