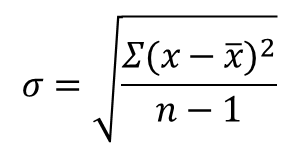
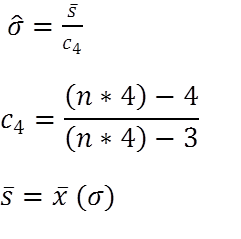
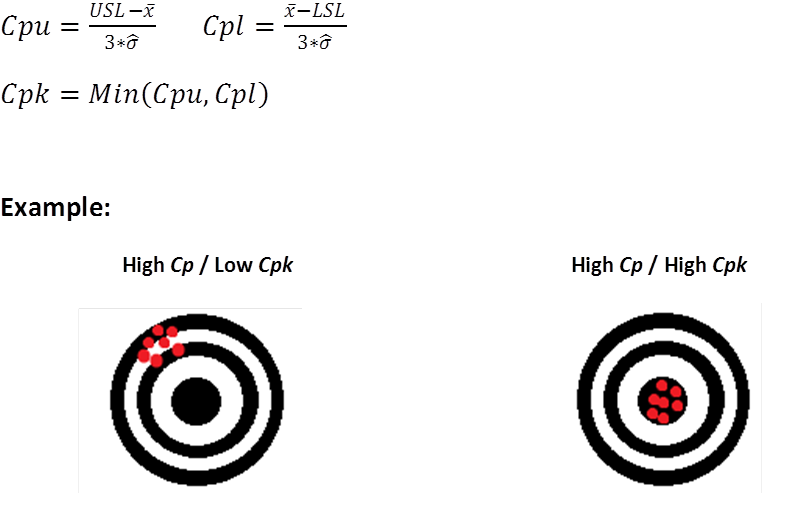
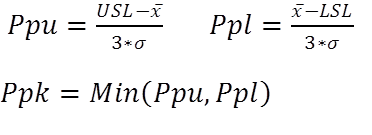
It all started when my colleague and I noted that we had used the same data to calculate Cpk, but ended up with different results. This led us down an Alice in Wonderland-like path of Google searching, Wikipedia reading, and blogosphere scanning. After several days of investigation, we determined that there was no consensus on how to properly calculate estimated standard deviation. Knowing that there must be a misunderstanding and that this should be purely an effort based on science, we decided to get to the bottom of this. My colleague and I decided that there was a need for a simple, accurate tool that anyone could use and afford. We wanted to break the economic and educational barriers that got in the way of conducting needed process capability studies. More on that in a bit. Our investigation revealed that the biggest confusion out there was with the following two symbols.  Or, regular sample standard deviation vs. estimated standard deviation (sporting that little hat over the sigma). Regular sample standard deviation is used to calculate process performance, or Pp/Ppk. It is based on the actual data that your process has actually proven to perform in current reality (overall performance). Estimated standard deviation is used to calculate process capability, or Cp/Cpk. In other words, what is your process capable of when at its current “best” state (within subgroups)? This leads us to the simple tool that I referenced above.
There’s an App for that
The creation of “Cpk Calculator App” has been a long and winding road with a lot of research and validation (also known as PDCA). But, in the end we created a tool that automatically calculates standard deviation in 1 of 3 ways depending on data set characteristics (The biggest dilemma on the web):
1. If data is in one large group, we use the regular sample standard deviation calculation:
 Many people use the calculation above to calculate standard deviation and call it Cpk, when in reality what they are calculating is Pp, or Ppk as they are not using estimated standard deviation. Ppk is definitely the more conservative of the two as it’s based on the actual standard deviation, but for whatever reason Cpk has become the more famous of the two.
And, they are often confused.
2/3. If you collect your data in subgroups, there are two preferred methods of estimating standard deviation using unbiasing constants:
Rbar / d2 is used to estimate standard deviation when subgroup size is at least two, but not more than four. The average of the subgroup ranges is divided by the d2 constant. This calculation is best when you tend to have many small sub groups of data.
 The calculations shown above reflect another way to estimate standard deviation that should be used when calculating estimated standard deviation of uneven sub groups, or sub groups larger than 4 data points.
Please see these links for the Cpk Calculator App on Google Play (for Android) and the Apple App Store.
More about Cp, Cpk vs. Pp, Ppk
Pp, and Ppk are based on actual, “overall” performance regardless of how the data is subgrouped, and use the normal standard deviation calculation of all data (n-1). Cp and Cpk are based on variation within subgroups, and use estimated standard deviation. Cp and Cpk show statistical capability based on multiple subgroups. Without getting into too much detail on the difference in calculations, think of the estimated standard deviation as the average of all of the subgroup’s standard deviations, and ‘regular’ standard deviation as the standard deviation of all data collected. Cp (process capability). The amount of variation that you have versus how much variation you’re allowed based on statistical capability. It doesn’t tell you how close you are to the center, but it tells you the range of variation. Note that nowhere in this formula is the average of your actual data referenced.  Cpk (process capability index). Tells you how centered your process capability range is in relation to your specification limits. This only accounts for variation within subgroups and does not account for differences between sub groups. Cpk is “potential” capability because it presumes that there is no variation between subgroups (how good you are when you’re at you best). When your Cpk and Ppk are the same, it shows that your process is in statistical control.
  Pp (process performance). The amount of variation that you have versus how much variation you’re allowed based on actual performance. It doesn’t tell you how close you are to the center, but it tells you the range of variation.
  Ppk (process performance index). Ppk indicates how centered your process performance range is in relation to your specification limits (how good are you performing currently).
What’s a "Good" Cpk?
A Cpk of 1.00 will produce a 0.27% fail rate, or a theoretical 2,700 defects per million parts produced. A Cpk of 1.33 will produce a 0.01% fail rate, or a theoretical 100 defects per million parts produced. In reality, the Cpk that is acceptable depends on your particular industry standard. As a rule of thumb a Cpk of 1.33 is traditionally considered a minimum standard.
Confidence Interval
Confidence interval shows the statistical range of your capability (Cpk) based on sample size. Basically the larger the sample size, the tighter the range. The confidence interval shows that there is an x% confidence that your capability is within “a” and “b.” The higher the confidence interval, the wider the range. For example, if we report a Cpk of 1.26, what we are really saying is something like, “I don’t know the true Cpk, but based on a sample of n=145, I am 95% confident that it is between 1.10, and 1.41 Cpk.” This tells us that the larger your sample size, the tighter the range. Therefore, the more data you collect, the more accurate your measurement, and the more accurate your actual process capability, or performance. In most calculations 90 or 95% confidence is required, but confidence interval can be calculated at any %, just remember the fewer data points, the wider the confidence interval range. 
Real Life Application
During the creation and testing of the Cpk Calculator App, we had the opportunity to test every scenario that we encountered in the real world. One of the real life scenarios that we ran into included a routine hourly check of a “widget’s” thickness that determined that the part was out of specification. After 15 minutes of data collection and testing on the floor using the app, we found that our process that normally had a Cpk of 1.3, now reflected a Cpk of 0.80. This led us to discover that the cutting machine cycle time had been reduced in an attempt to improve throughput and productivity by the machine operator. With that in mind, we reset the machine to original settings to confirm that we had found the root cause. Subsequently, we used the Cpk calculator as we gradually reduced cycle time as much as possible without negatively affecting process capability. In the end, we confirmed root cause, and implemented a new and improved cycle time for the piece of equipment. ________________________________________________________  This post was authored by Levi McKenzie, a continuous improvement kind of guy who enjoys exploring new facets of lean methodology, facts, data, and making things faster and better. Levi Is a co-founder of Brown Belt Institute, a mobile app development company that focuses on providing useful lean six sigma tools that are inexpensive and easy to use for the "blue collar brown belt" sector.

