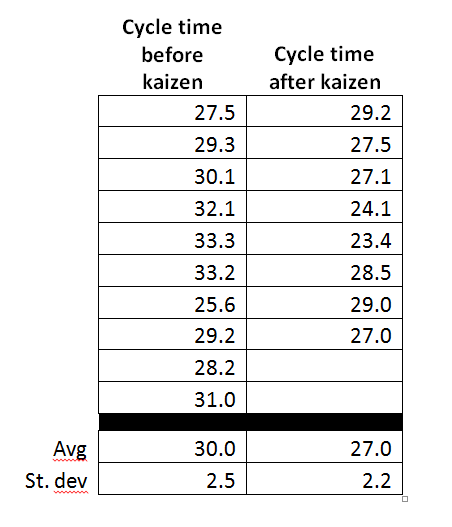
So you cut your cycle time by 10%.
...Or did you?
We are constantly experimenting. We make improvements, measure our performance and update standard work. In comparing the cycle time before and after a kaizen, you calculate a 10% improvement. Is it time to do declare victory and move on (as much as that's possible) to the next challenge?
How do you know if the measured improvement is “real”? That is, how do you know if the observed 10% improvement is significant or if it could have happened by chance? A simple t-test can help answer that question. It compares, in this situation, the average cycle time before the kaizen to the average cycle time after the kaizen and determines how likely it is that the change in cycle time occurred by chance.
If the 10% improvement has an 85% likelihood of occurring by chance, then we probably want to hold off on the celebration party. But if the improvement only has a 2% chance of occurring by chance, then we can be fairly confident that the change is real.
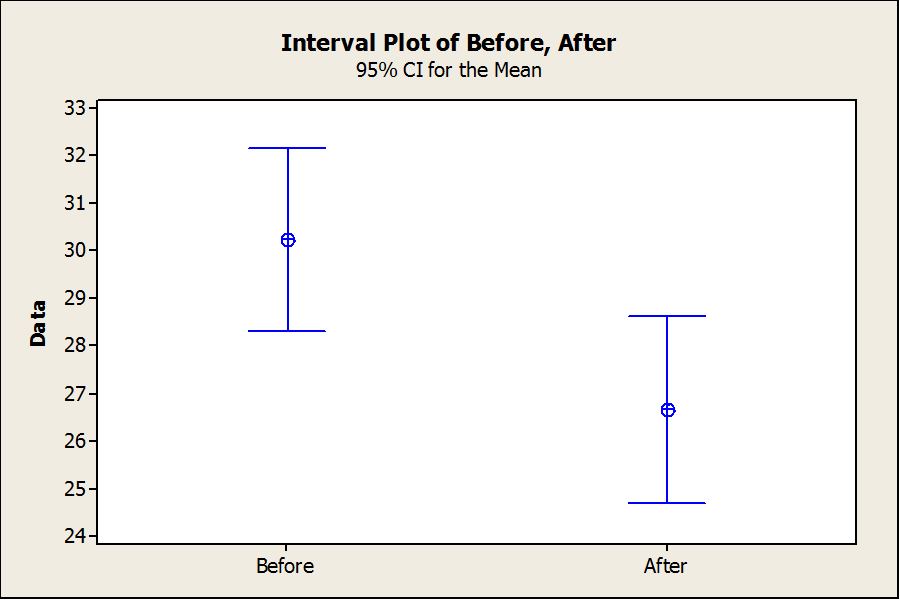
The interval plot below shows the 95% confidence interval for the mean cycle time before and after the kaizen. Based on our sample, we are 95% confident that the actual average cycle time before the kaizen is somewhere between 28.2 and 31.7 (by the way, this is purely an example, the unit of measure could be seconds, minutes, days, weeks, etc.). Likewise, we are 95% confident that the average cycle time after the kaizen is somewhere between 25.2 and 28.8. So, it is possible that the average cycle time after the kaizen is actually not less than the average cycle time before the kaizen, but clearly that scenario is unlikely.
How unlikely? That is exactly what the t-test calculates.
There are a number of software packages that perform t-tests. Two decisions need to be made prior to making the calculation: 1) should the calculation assume that the two samples have equal variances, and 2) are you interested in determining if the averages are not equal or if one is greater than or less than the other (i.e. what is the alternative hypothesis for the t-test)? For this dataset, the variances are sufficiently close such that they can be treated as equal and we are interested in determining if the average cycle time after the kaizen is less than the cycle time before the kaizen. Given these two assumptions, the likelihood that the observed differences in the average cycle time before and after the kaizen occurred by chance is 0.009 or 0.9%. (Statisticians refer to this as the p-value.)
So, given that it is unlikely that the observed 10% reduction in cycle time occurred by chance, the team can reasonably celebrate their improvement and move on to the next challenge.


