The seminal book on lean, The Machine that Changed the World, spent many words, tables, and figures on the subject of productivity (as well as, of course, quality).
Why?
Productivity is one of the critical few measures that reflect the “leanness” of a process, value stream or enterprise. It captures how effectively an organization uses its resources, and it’s usually a meaningful way to compare performance over time and between entities.
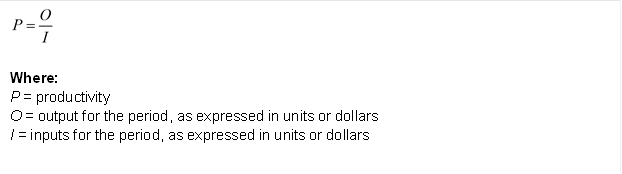
Productivity is the ratio between the outputs of goods or services and the inputs applied for the purpose of that output. There are two typical applications of this ratio – single-factor productivity and multi-factor productivity. Labor is often the single factor and is referred to as labor productivity. Another popular single factor is machine productivity.
Labor productivity captures the output per labor input. Outputs are often units, but can also be reflected in the dollar value of the labor. Multi-factor productivity, as the name implies, takes into account multiple inputs; typically labor and resources such as capital equipment, energy and material. The common unit of measurement for multi-factors is almost exclusively dollars.
Example productivity ratios include:
- units per labor hour
- units per person per hour
- units per labor dollar
- sales per person
- units per machine hour
- units per square foot
- sales per square foot
- total processing cost per unit
The number of different productivity measurement is limited only by the imagination. But, like anything, the measurement must be pragmatic and help drive the proper lean behavior with a focus on period over period improvement within the process, value stream and enterprise.
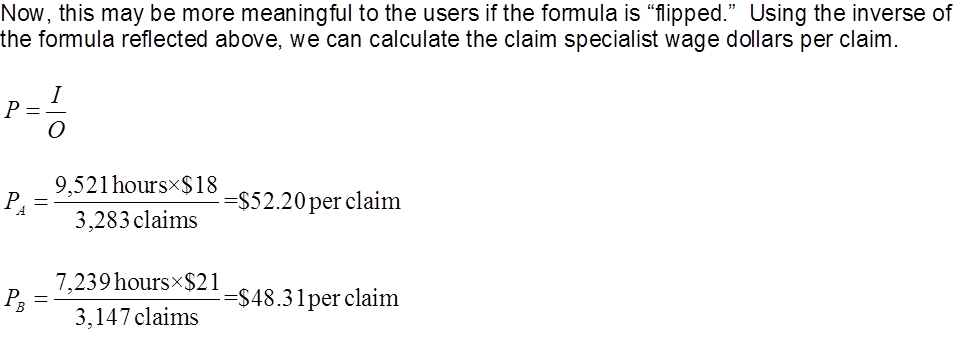
The formula and ABC Company example(s) follow:

Some other things to think about:
- Understanding productivity is important. However, lean practitioners also distinguish between local and total (think “system”) productivity. So, while a cell or department’s productivity level is important, the total value stream is even more critical.
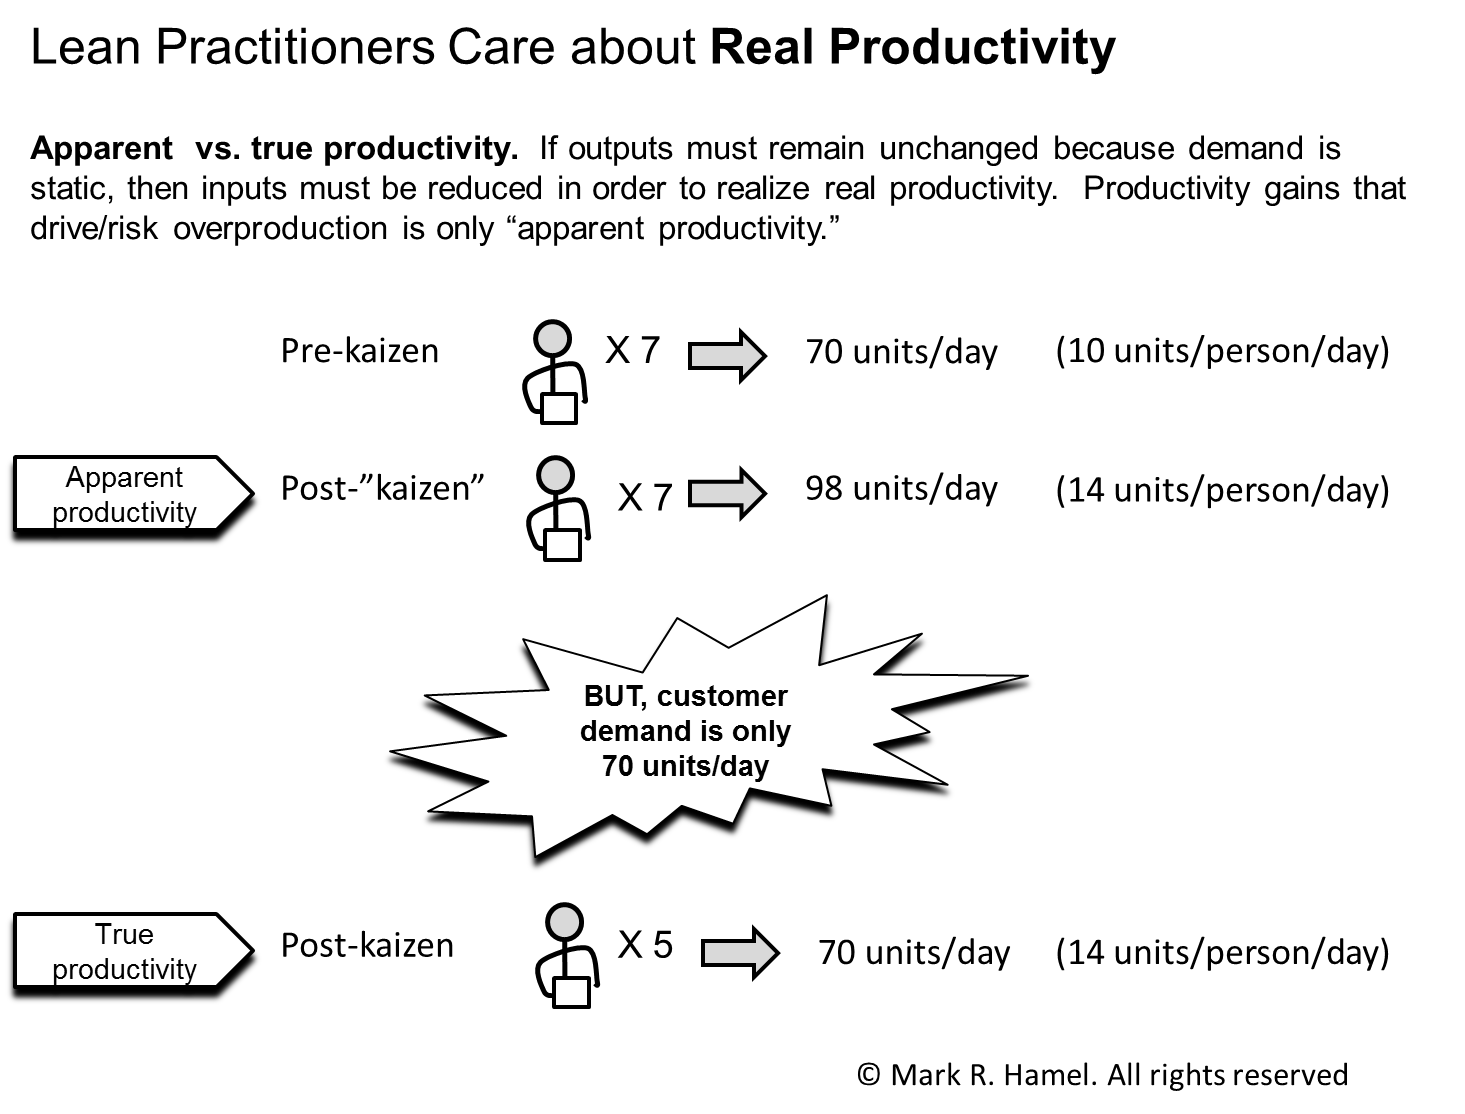
- Don't be fooled! Understand the difference between real and apparent productivity:
- When comparing productivity rates between lines, cells, value stream, locations, etc. it is important to understand relative work content. If work content varies substantially between areas, the productivity comparison may be misleading and require the use of common units.
- “Underutilized” inputs can distort productivity calculation results. For example, abnormally low demand can cause productivity to plummet. In such a situation, it may make sense to also calculate labor productivity only using the hours which the operators were working (other hours may have been heavily invested in cross-training and improvement activities).
Related post: Efficiency (and not productivity)